Briefings
Riskier, or just unknown? What 900,000 auto loans with no reported credit score show
A credit score is the shorthand most of the market uses for a borrower's risk. Lenders don't always need one: many lean on their own models, and some borrowers have no score to pull. But for investors, the score is the common language for comparing loans across lenders. So what happens when it's missing?
About one in 33 auto loans packaged into public bonds has no credit score attached. The lender still made a credit decision; investors just see a blank. CCM looked at all of them: about 917,000 loans in 495 SEC-registered securitizations from 26 issuing programs, out of roughly 30 million loans, covering every deal that has filed loan-level data since that reporting began in late 2016, followed monthly through August 2026. Four questions: where are they, why do they lack a score, who are they, and how have they performed?
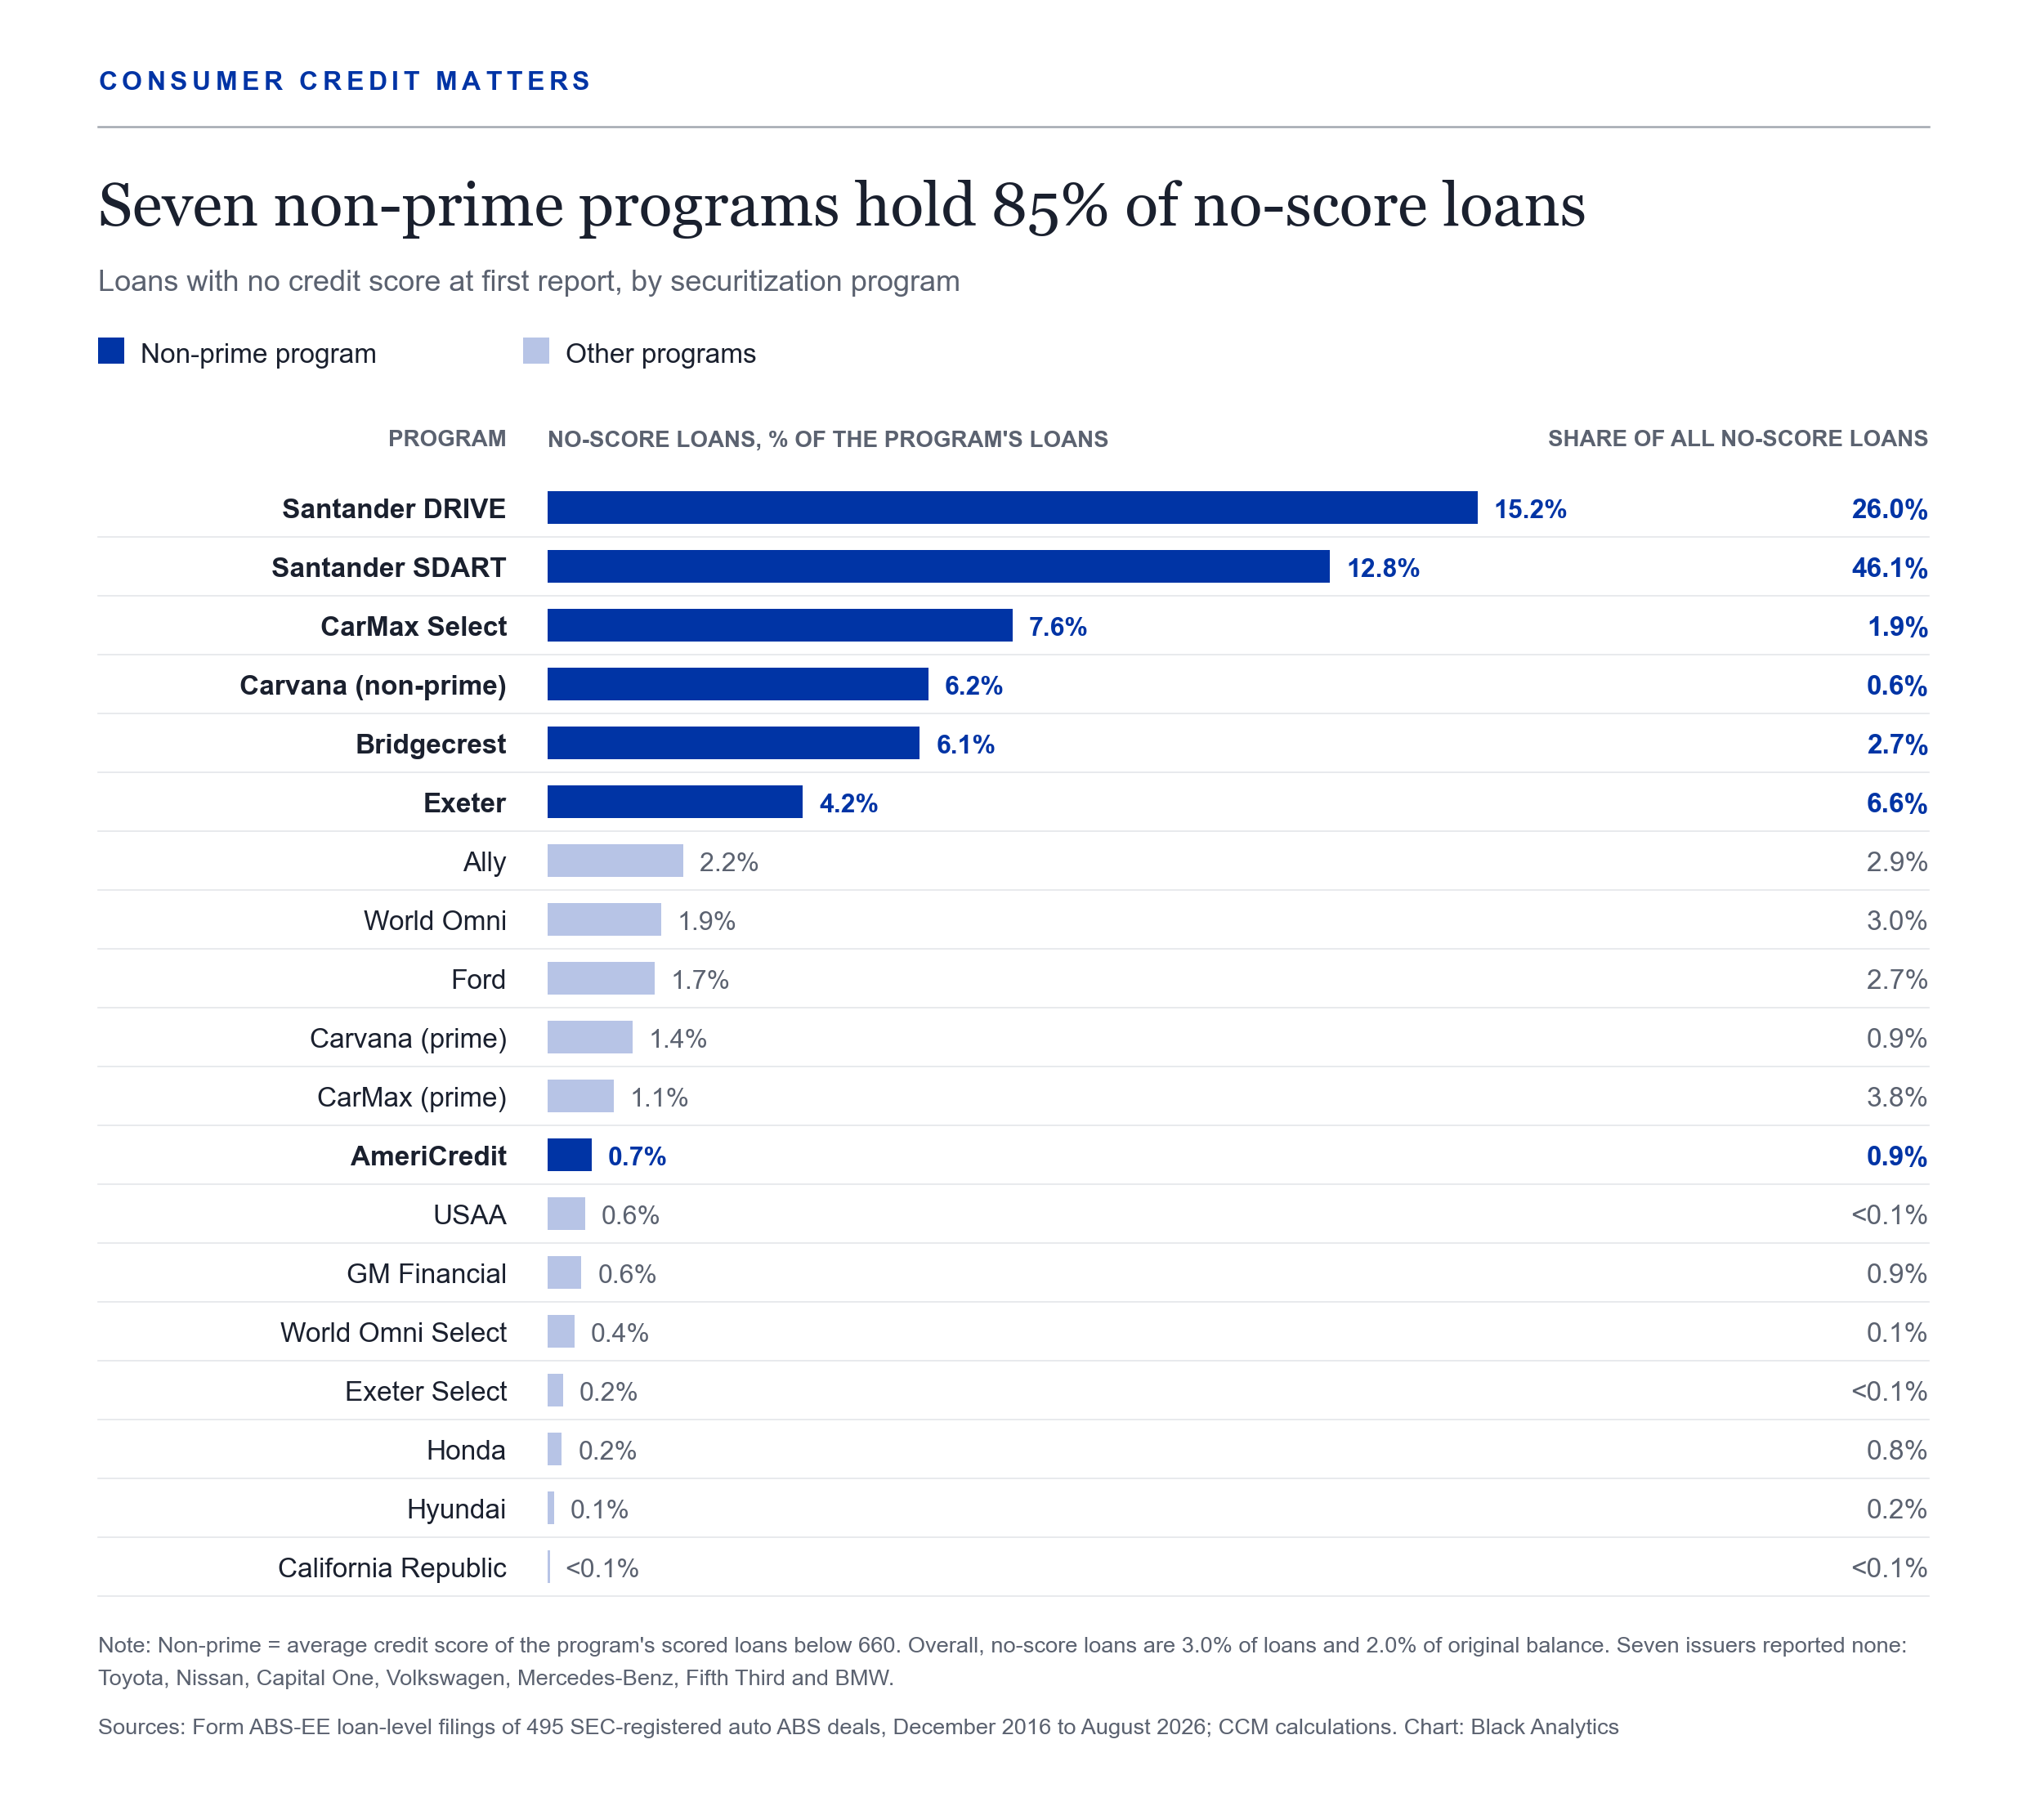
Where they are. No-score loans are 3.0% of all loans and 2.0% of original balance, and they are concentrated in non-prime programs: seven of them hold 85% of all no-score loans, and Santander's two alone hold 72%. Within those seven, the no-score share ranges from 0.7% of loans at AmeriCredit to 15.2% at Santander's DRIVE trusts. Everywhere else it is 0.6%, and seven issuers reported none (Exhibit 1).
Exhibit 1
Why a loan has no score. "No score" on the tape means no bureau score reported, not no credit evaluation. Lenders decide on their own proprietary scores, built partly from bureau data where it exists, and those scores aren't on the tape. Most prospectuses report the share of loans without a bureau score but not why. Ford is the exception: its unscored borrowers "(a) are not individuals, or (b) are individuals with minimal or no recent credit history." Other filings add business, employee and rebooked loans (World Omni), and a reporting convention: Exeter and Santander report only the primary borrower's score, left blank "regardless of any co-obligor's credit score."[1] The data don't say how often each cause applies. Part of it is which score a lender pulls: when Exeter, Bridgecrest and Carvana began using or reporting a VantageScore, and CarMax set a minimum FICO for its prime trusts, their no-score shares dropped abruptly from one deal to the next, though the filings don't say the switches caused the drops.[2]
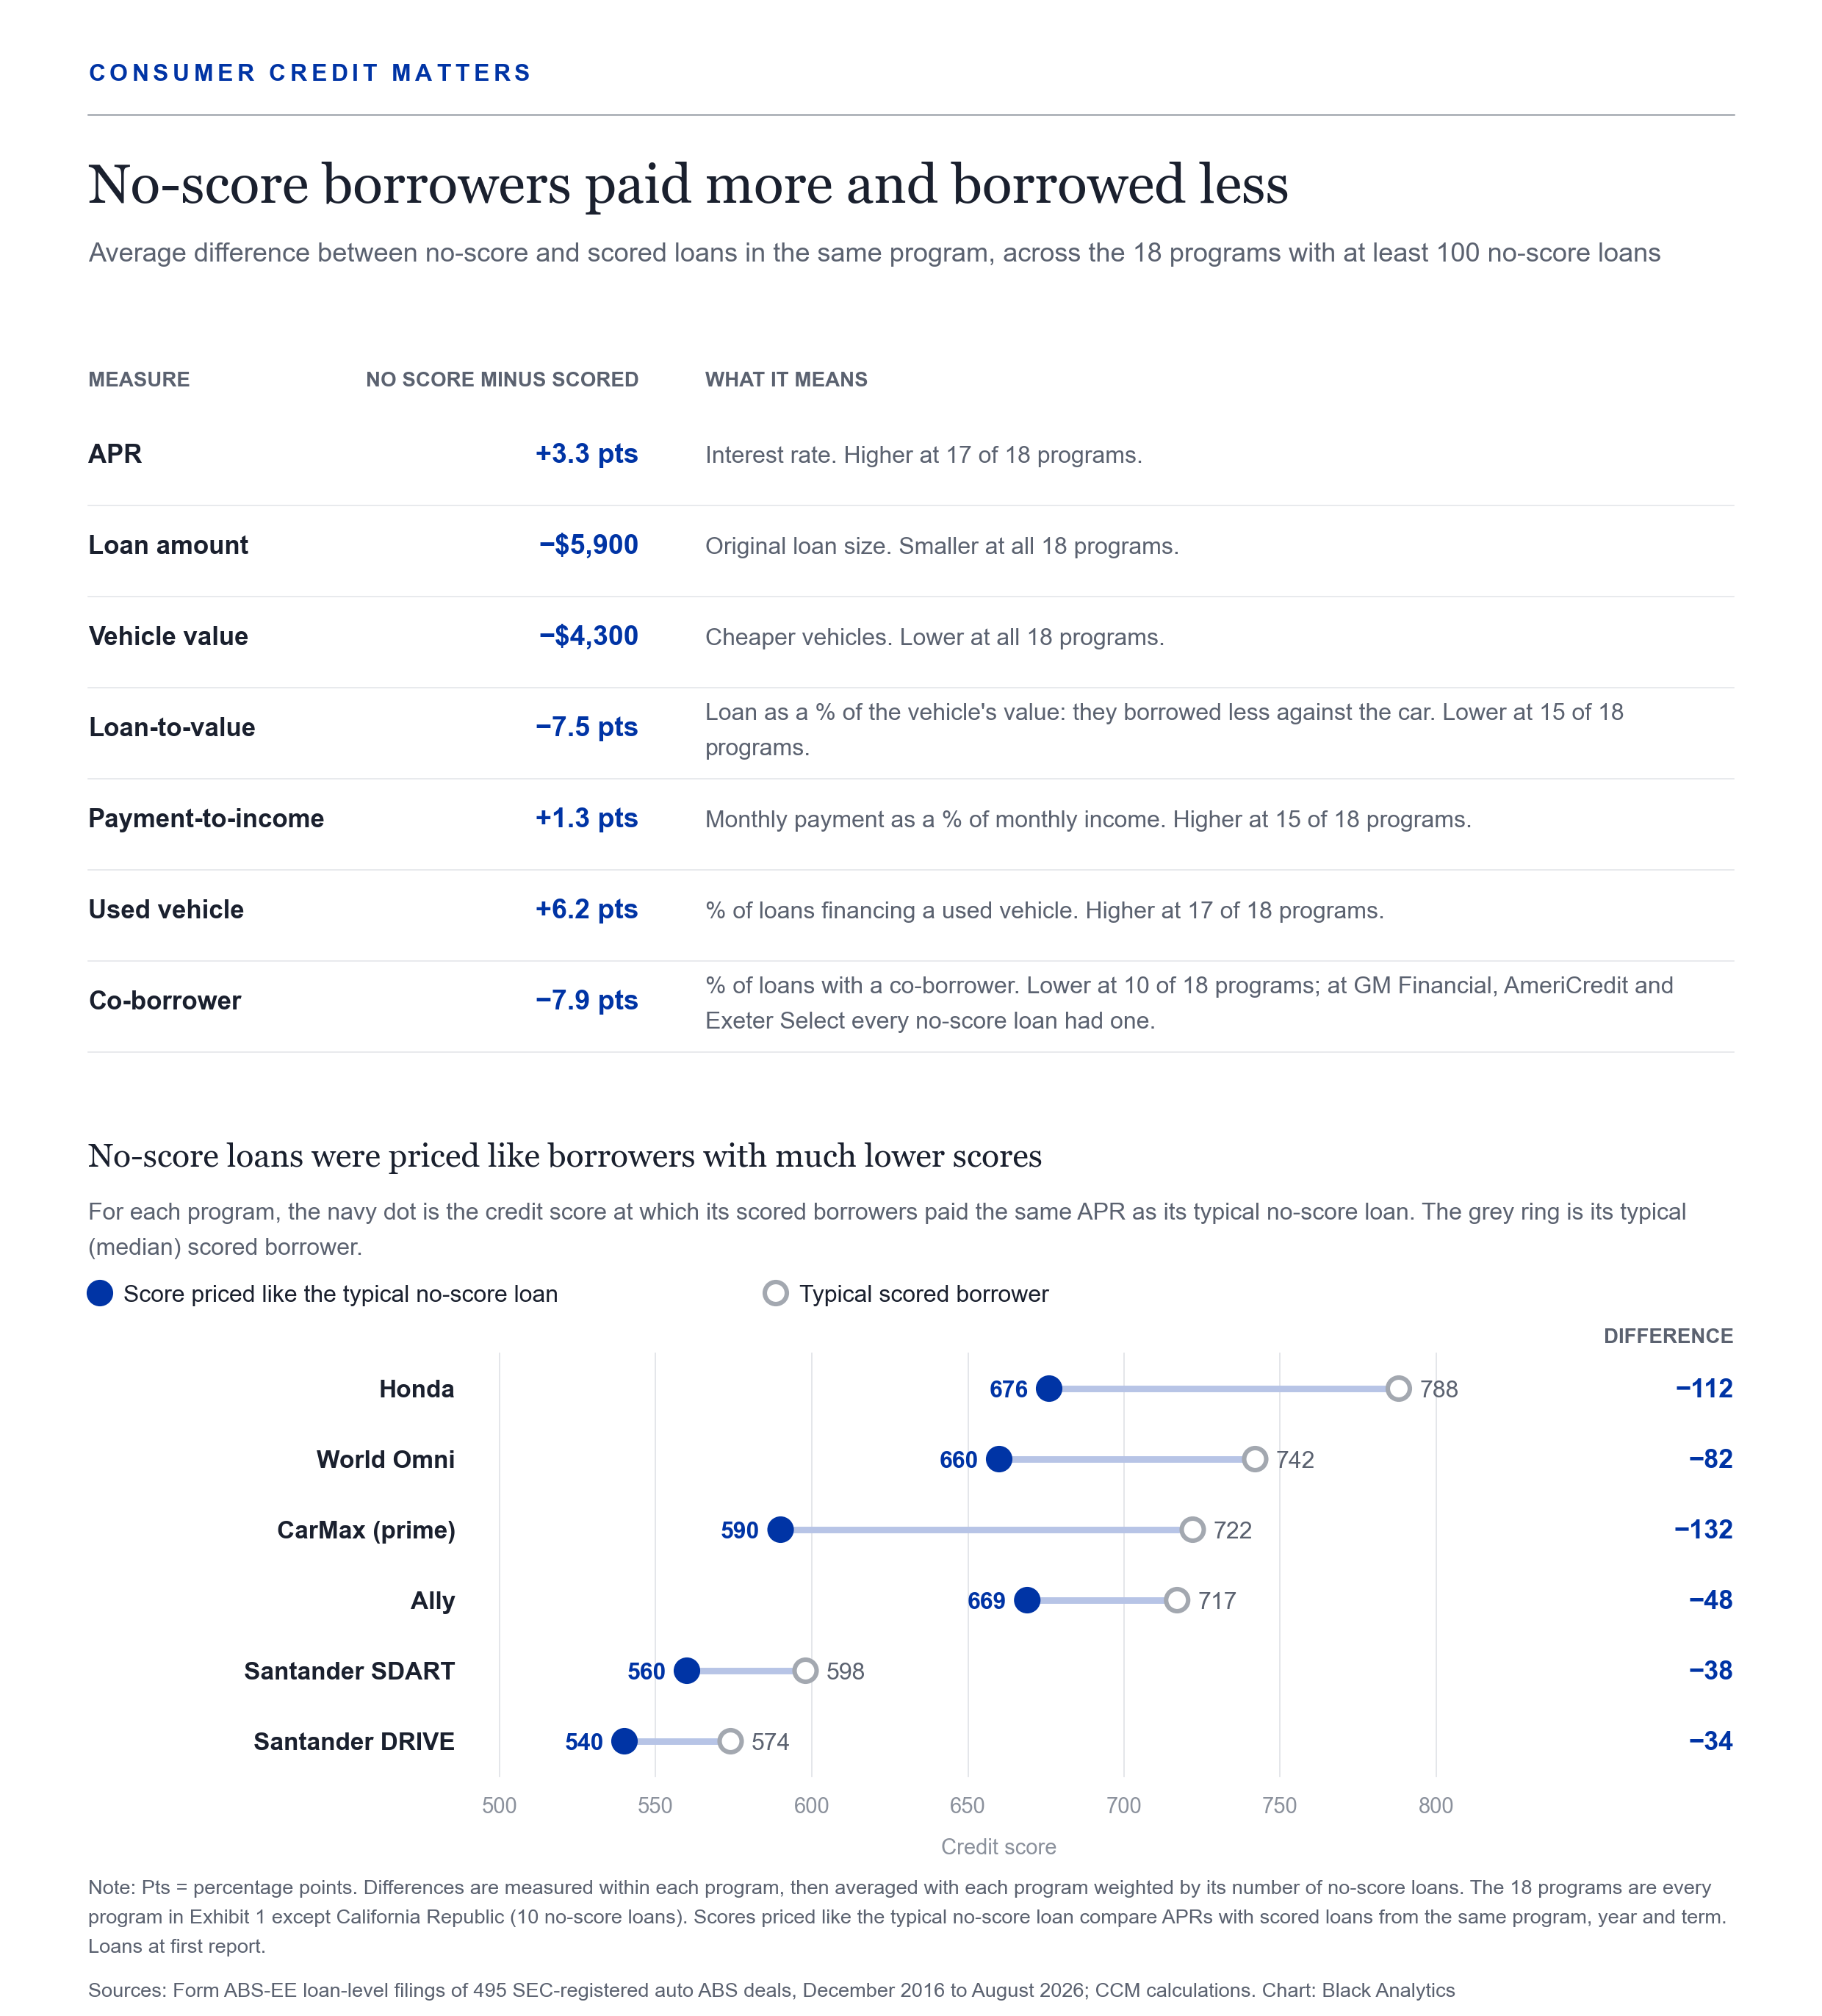
Who they are. Compared with scored borrowers in the same program (the 18 programs with at least 100 no-score loans), no-score borrowers took out smaller loans (about $5,900 less) on cheaper vehicles, more often used, borrowing less relative to the car's value (loan-to-value 7.5 points lower) but with higher payments relative to income. Of the 11 programs that report whether income was verified, 9 checked no-score borrowers' income more often than scored borrowers' (at CarMax, 38% vs 0.2%). They had co-borrowers less often at 10 of 18 programs; at GM Financial, AmeriCredit and Exeter Select, every no-score loan had one.
And they paid more: APRs averaged 3.3 points above scored loans in the same program, higher at 17 of 18 programs. Against scored loans from the same program, year and term, the typical no-score loan carried an APR like that of a scored borrower well down the scale: around 590 at CarMax, where the median scored borrower is 722, and around 560 at Santander's SDART, where it is 598 (Exhibit 2).
Exhibit 2
How they performed. Across all programs combined, 23.7% of no-score loans had been 60 or more days past due (60+ DPD) at least once within 24 months of origination, against 10.5% of scored loans.[3] That gap mostly reflects where no-score loans sit: at subprime lenders, where all loans fall behind more often. Lender by lender, no-score loans did worse at every prime program (12.5% vs 1.9% at Hyundai) and about the same or better at subprime ones (23.2% vs 24.3% at Santander's SDART trusts) (Exhibit 3).
Exhibit 3
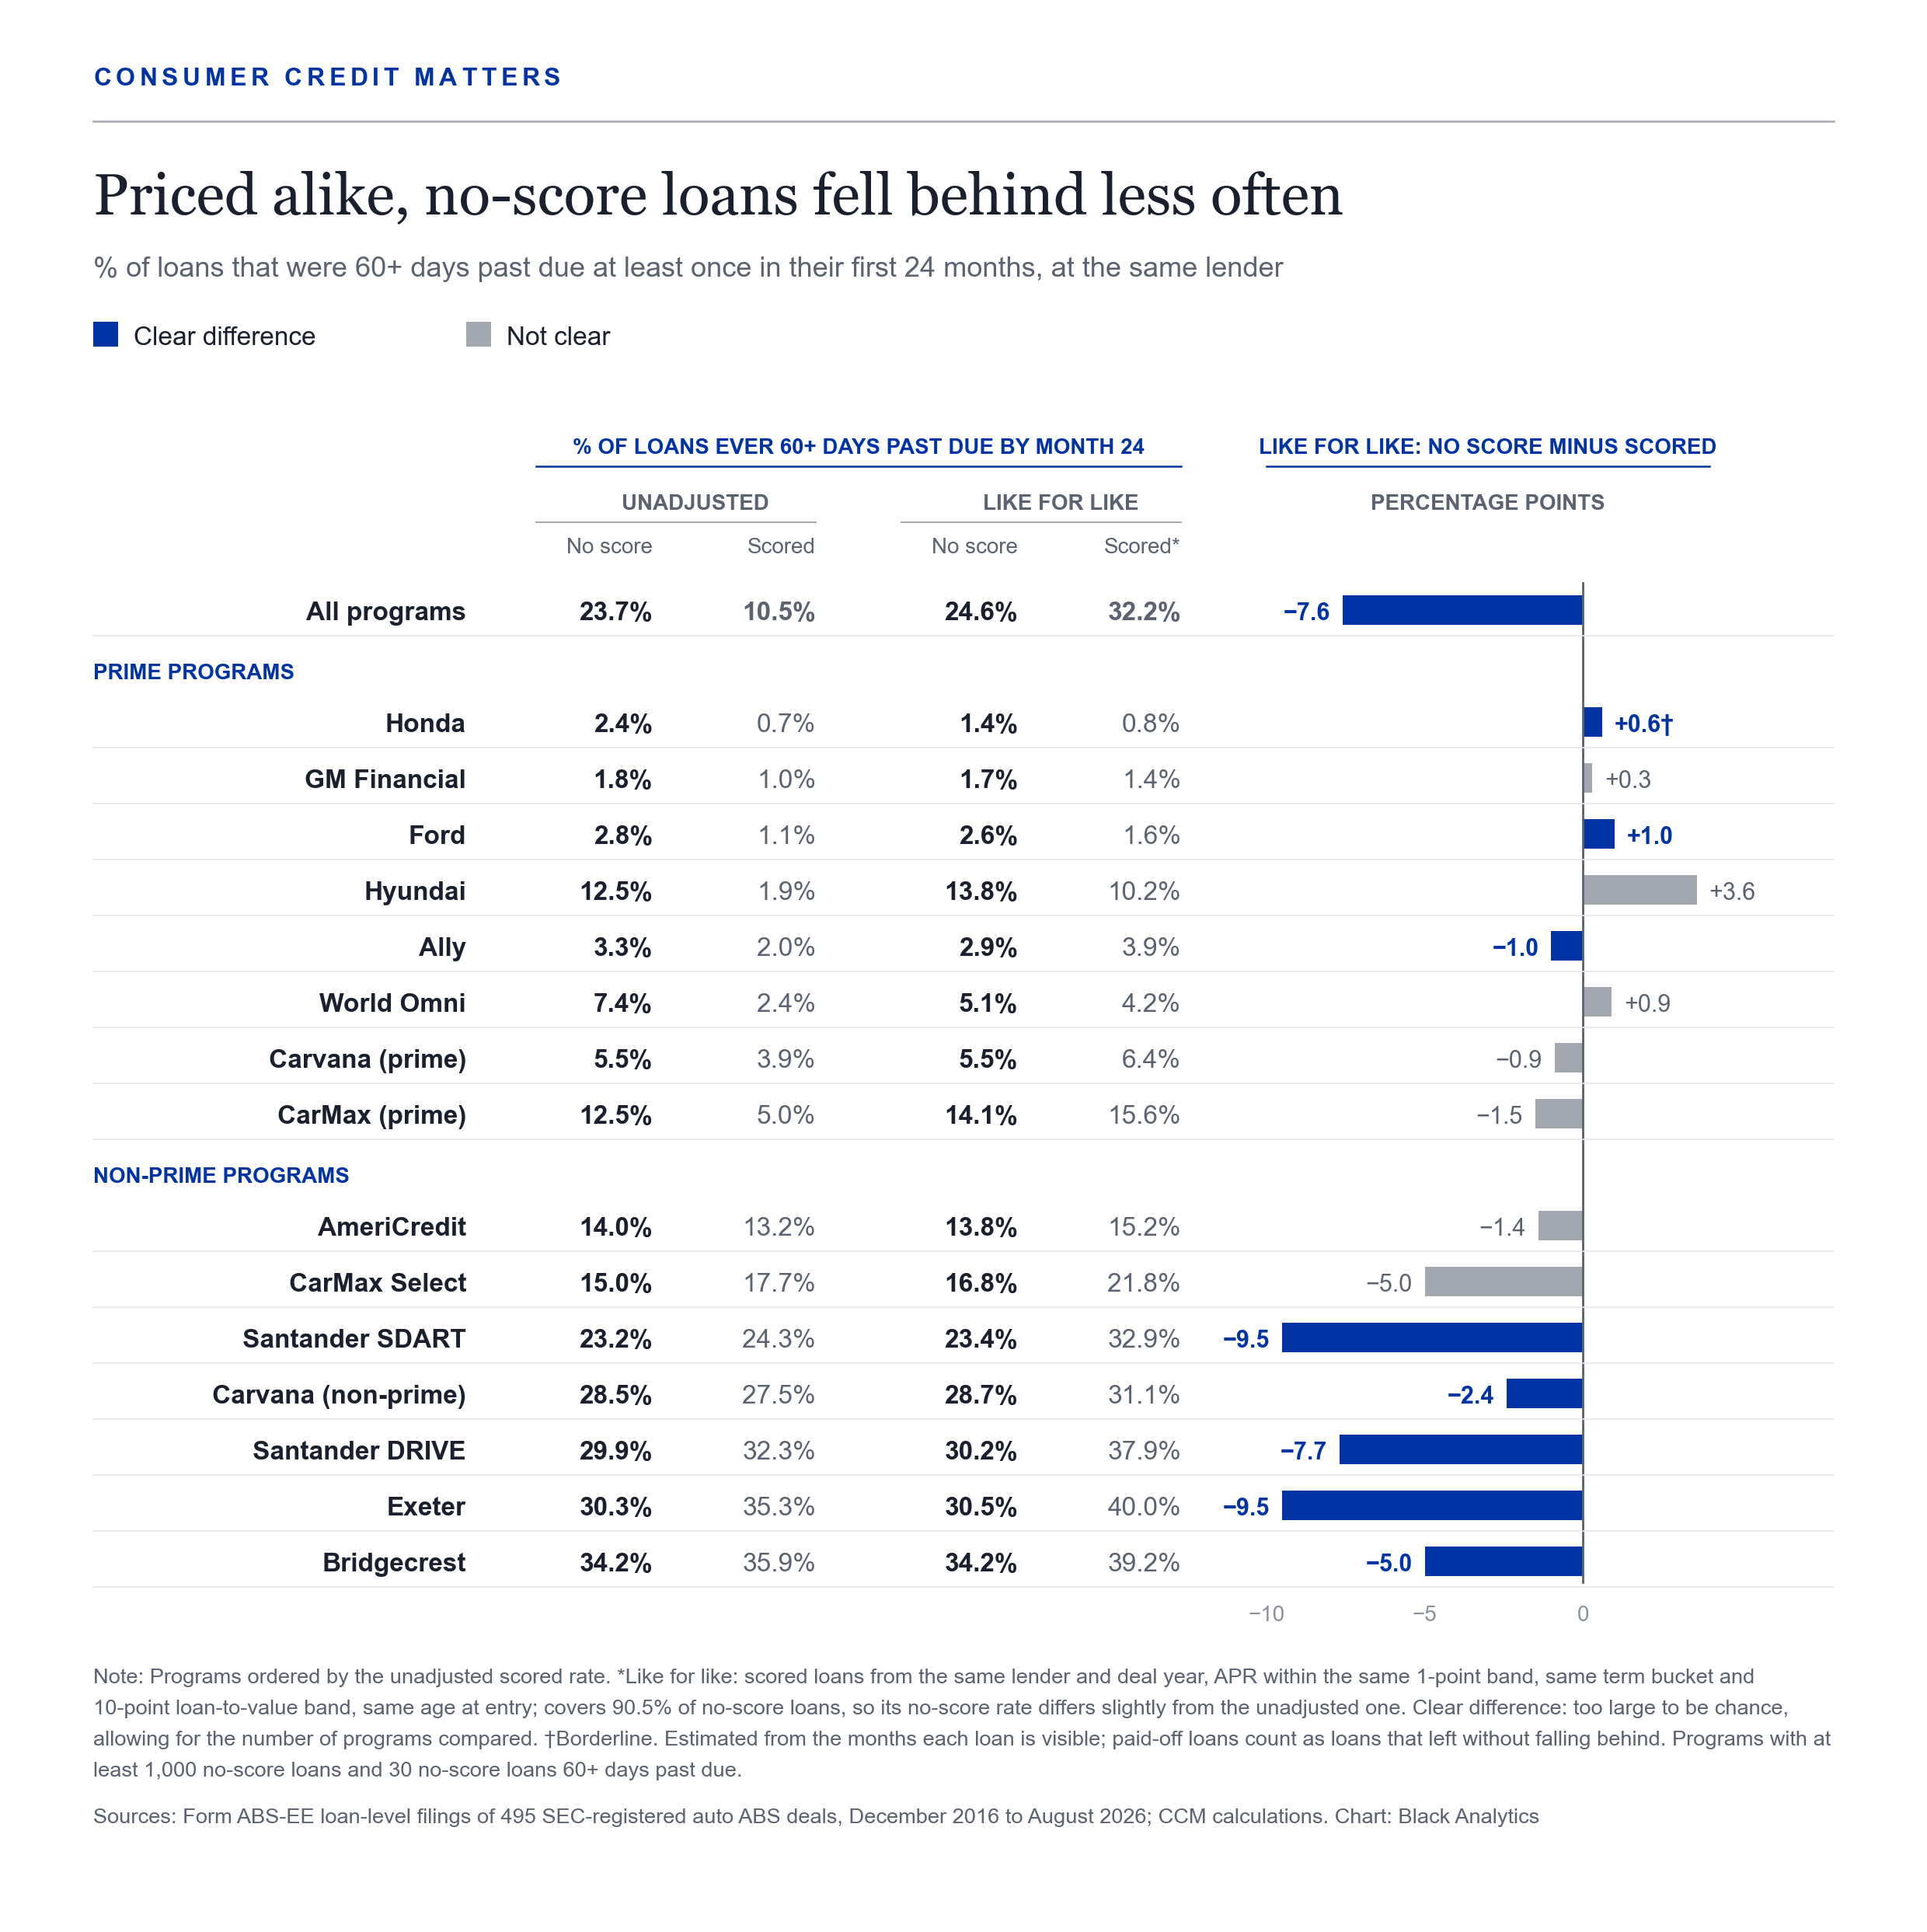
Is that more than lenders expected? The fairer test compares no-score loans with scored loans the lender treated the same way: same lender and year, nearly the same APR, term and loan-to-value, and the same age at entry. On that basis, no-score loans fell behind less often than scored loans priced the same way: 24.6% had reached 60+ DPD by month 24, against 32.2% of comparable scored loans.[4]
Why would no-score loans do better at the same price? The same 20% APR at Santander can come with different information: for a scored borrower, a credit record that shows trouble; for a no-score borrower, no bureau score at all. The results are consistent with lenders charging a premium for that uncertainty.
Where it held: clearly at Santander's two programs, Exeter, Bridgecrest, Carvana's non-prime deals and Ally; lower, but not conclusively, at CarMax, CarMax Select, AmeriCredit and Carvana's prime deals.
The exception is two prime captives. At Ford and Honda, no-score loans did somewhat worse than comparable scored loans: 2.6% vs 1.6% at Ford and 1.4% vs 0.8% at Honda, where the result is borderline. World Omni, GM Financial and Hyundai leaned the same way, but not distinguishably. No-score loans are rare at all five, under 2% of loans.[5]
CCM read: On raw numbers no-score loans look riskier, and at prime lenders they are. But lenders price them accordingly. Against scored loans priced alike, no-score loans have so far fallen behind less often at the subprime programs, where most of them sit, and somewhat more often at Ford and Honda, where they are rare.
- [1]Ford Credit Auto Owner Trust 2026-C prospectus (424B2). Explanatory exhibits (Ex. 103) to Form ABS-EE filings: World Omni's zero scores include "business loans, rebooked loans, and employee loans"; Exeter and Santander report only the primary borrower's score, blank "regardless of any co-obligor's credit score." Monthly servicer reports (CCM review of 21,200 Form 10-D filings) don't mention scores. ↩
- [2]Share of each deal with no score: Exeter, 7–11% to under 3% from 2022-6, after it adopted VantageScore in underwriting in September 2022; Bridgecrest, 7–8% to 2–4% from 2025-4, after switching from FICO to VantageScore in June 2025 (it says it uses neither to underwrite); Carvana's prime deals, 3–5% in 2025 to zero in 2026, once it reported a VantageScore on every loan; CarMax's prime trusts, about 1% to zero from 2024-3 (minimum FICO of 650), while CarMax Select carries 5–9%. Comparisons here are within lender and deal year, so these shifts don't affect them. ↩
- [3]CCM used the loan-level data issuers file monthly with the SEC. "No score" means the issuer reported none (recorded seven different ways); any FICO or VantageScore counts as scored, and loans labeled business accounts are excluded. Scored-loan counts match CCM's published delinquency data in all 495 deals. Many trusts buy loans already a year or two old, so each loan counts only for the months it is visible; monthly rates of first reaching 60+ DPD are combined into the share reaching it within 24 months, with paid-off loans counted as leaving without falling behind. For loans followed from origination, this equals simple counting. ↩
- [4]Like-for-like matches cover 90.5% of no-score loans. The result holds without Santander (19.1% vs 23.0%), without the groups that may include business accounts (25.2% vs 33.1%) and using only loans seen from their first month (27.6% vs 36.5%). Loans bought later behaved like loans seen from origination at the same age. A regression with the same controls gives an odds ratio of 0.75 (95% interval 0.72–0.79, clustered by deal). Program results use deal-level resampling, adjusted for 15 comparisons (Holm). ↩
- [5]No-score loans 60+ DPD by month 24 number 42 to 538 per program at these five. Among loans with no manufacturer subsidy, the captives' gap is not distinguishable from zero. World Omni's no-score group also includes business, rebooked and employee loans. ↩
Swipe fees are now a midterm talking point, and a four-year-old bill suddenly has a deadline
With the November 3 midterms three weeks out, the Credit Card Competition Act has resurfaced as a White House affordability talking point. The target is interchange — the “swipe fee” a merchant pays the card-issuing bank on every transaction, roughly 1.5–3% of the sale, and distinct from the APR the cardholder pays. President Trump endorsed the Durbin–Marshall bill in January, it was reintroduced in both chambers the same day, and it has stayed in the administration’s cost-of-living messaging since. Vice President Vance was a Senate co-sponsor of the 2023 version. The mechanics are unchanged: issuers over $100 billion in assets would have to enable a second, unaffiliated network on every card, and the merchant picks the route.
Endorsement hasn’t meant passage. The bill still sits in Senate Banking, and the sponsors’ attempts to attach it to must-pass legislation — most recently the housing bill in March — failed. Banks and networks have kept it off the floor for four years running. The election puts it on the clock.
CCM’s June 2024 piece framed this as three tracks converging on one outcome: lower card fees. The scorecard since: the CFPB’s $8 late-fee cap was vacated by a Texas court in April 2025, with the Bureau’s assent. The Visa/Mastercard interchange litigation produced a revised $38 billion settlement that won preliminary approval in June — a 1.25% interchange cap on standard consumer cards, a 10 bp cut to the average effective interchange rate for five years, and the end of “honor all cards.” One track dead, one nearly done, and the legislative one now has the White House.
CCM read: The 2024 conclusion stands. Interchange funds rewards and underwrites the economics of the cards that drive issuer volume; cut it and issuers reprice through APRs, annual fees and thinner rewards, and tighten at the margin. The Durbin debit precedent says merchants, not consumers, keep most of the savings. For card ABS, interchange sits inside finance-charge collections, so the settlement alone trims trust yield; CCCA on top would compress excess spread a second time. The affordability pitch is popular; the bill mostly moves money from cardholders to merchants.
Card balances posted their biggest drop since 2024, but the three-month trend says stalled, not shrinking
Consumer credit grew at a 1.9% annual rate in August. Revolving credit, mostly cards, fell at a 4.2% rate, a $4.8 billion drop and the largest monthly decline since November 2024. Nonrevolving credit (autos and student loans) rose at a 4.1% rate and supplied all of the growth. One month is noisy, so the better read is the trend: card balances are still up 3.2% from a year ago, but the three-month annualized pace has gone from 7.0% in April to 1.3% in August. Cards ran hot in the spring and have been flat since June, while the average APR on accounts carrying a balance moved back above 22%. The nonrevolving side flatters: August includes the fall student loan disbursement and a Labor Day shift that pulled auto sales forward from September.
CCM read: Total consumer credit is up about 2.7% from a year ago against 3.4% inflation, so in real terms households aren’t adding debt; they’re financing the same spending at higher prices. For card ABS, paydown shows up as a higher principal payment rate and slower receivables growth: good for trust credit, less good for excess spread as revolvers are replaced by transactors. The September remits will show whether it reached the securitized books.
The 30-year hits 7.40%, and existing-home sales are already below 4 million
Freddie Mac’s 30-year fixed rose to 7.40% for the week of October 8, up from 7.28% and from 6.30% a year ago, the highest since late 2023. That lands on a housing market that was already stalled: NAR’s August report had existing-home sales at a 3.98 million annual pace, the first sub-4-million reading since June 2025, with months’ supply at 4.9 and the median price up 1.6% from a year ago, flat in real terms. Inventory is rising and prices have stopped climbing; buyers are not coming back at these rates.
CCM read: The consumer credit angle is that the household balance sheet is frozen, not fragile. Most outstanding mortgages carry rates far below today’s, so the cash-out refinance channel is closed, and HELOC borrowing, while growing (balances up $13 billion in Q2 to $459 billion), is small next to what cash-out refis supplied in 2021. That pushes marginal consumption onto cards and keeps the payment hierarchy tilted toward the mortgage: the house payment gets made, the card payment is what flexes. Expect card trust performance to reflect price pressure before it reflects housing pressure.
Initial claims at 197k and continued claims near a three-year low, and the labor market is still not where the stress is
Initial claims printed 197,000 for the week ending October 3, down 2,000, with the four-week average at 198,000. Continued claims rose 17,000 to 1.716 million for the week ending September 26, but that follows a revised 1.699 million that was the lowest since March 2023, and the series has held in a 1.70 to 2.0 million band since mid-2023. Both measures are low. Claims only capture insured unemployment, so they don’t see every income-stressed borrower, but there is no layoff wave in this data.
CCM read: For nonprime auto and card pools, the variable that drives cure rates is how long a laid-off borrower stays off payroll, not how many get laid off. That makes continued claims the line to watch, and right now it is benign. The stress visible in card paydown and student loan delinquency is a rate and price story, not a jobs story.
Student loan 90+ delinquency rises to 10.6%, but the flow into delinquency has halved
The NY Fed’s Q2 report put student loan balances 90+ days past due at 10.6%, up from 10.3% in Q1 and far above any other consumer loan type. The stock keeps rising largely for a mechanical reason: during the pandemic payment pause, servicers reported every federal borrower as current, including those already in default. Since reporting resumed in late 2024, those defaults have been flowing back into the bureau data, and the Fed itself flags the distortion. The flow of new trouble is slowing: the annualized rate at which balances not yet seriously delinquent crossed 90 days fell to 7.8% in Q2 from 12.9% a year earlier.
CCM read: For ABS this is a scoring story, not a collateral one. Student loans are a small share of securitized consumer collateral, but the borrowers are the same people who hold the cards and auto loans in those trusts. A re-reported default drops a score, and a dropped score reprices the next card or auto origination. The drag on prime-pool composition arrives through underwriting cutoffs, not through student loan ABS.
New Deals & Presale Reports
8 publicly registered issues this weekEach deal opens its CCM presale report. SEC publicly registered transactions only — 144A and private placements excluded. Full library: CCM Issuance table.
| Issuer / Series | Asset class | PSR | Close | Size ($MM) | WAL (yrs) | WA FICO |
|---|---|---|---|---|---|---|
| Preliminary — final prospectus not yet filed | ||||||
| TAOT 2026-DToyota Auto Receivables 2026-D Owner TrustPrelim | Auto Loan | Oct 15 | 1,900.0 | 2.48 | 772 | |
| BLAST 2026-4Bridgecrest Lending Auto Securitization Trust 2026-4Prelim | Auto Loan | Oct 22 | 750.0 | 1.32 | 575 | |
| MBALT 2026-BMercedes-Benz Auto Lease Trust 2026-BPrelim | Auto Lease | Oct 15 | 1,322.4 | — | 788 | |
| CAOT 2026-4CarMax Auto Owner Trust 2026-4Prelim | Auto Loan | Oct 21 | 1,000.0 | — | 765 | |
| Priced this week | ||||||
| BMWLT 2026-2BMW Vehicle Lease Trust 2026-2 | Auto Lease | Oct 14 | 1,250.0 | 2.07 | 792 | |
| GMCAR 2026-4GM Financial Consumer Automobile Receivables Trust 2026-4 | Auto Loan | Oct 14 | 1,015.8 | 2.44 | 773 | |
| Closed this week | ||||||
| COMET 2026-3Capital One Multi-asset Execution Trust Class A(2026-3) Card series Notes | Credit Card | Oct 08 | 850.0 | — | 719 | |
| COMET 2026-4Capital One Multi-asset Execution Trust Class A(2026-4) Card series Notes | Credit Card | Oct 08 | 650.0 | — | 719 | |
Loan-Level Pulse
Reproducible signals · ABS-EE surveillanceA few signals from this week's loan-level tape — each links to the exact view on CCM so you can reproduce it. Explore the full data ›
Mercedes-Benz
Macro
Rates · Used cars · ConsumerContinued Claims
Median Existing Home Price
Housing Affordability Index
Underemployment
On Deck
Data releases · ABS-EE filings · eventsMacro releases
- Oct 12Housing Affordability Index
- Oct 12Median Existing Home Price
- Oct 12Existing Home Months Supply
- Oct 12Existing Home Sales
- Oct 14Used Car CPI
- Oct 14New Car CPI
- Oct 14Auto Repair CPI
- Oct 14Auto Parts CPI
- Oct 14Headline CPI
- Oct 14CPI (Not Seasonally Adjusted)
- Oct 14Core CPI
- Oct 1515-Year Mortgage Rate
- Oct 15Consumer Confidence (OECD)
- Oct 15Retail Sales
- Oct 1530-Year Mortgage Rate
- Oct 15Initial Claims
- Oct 15Continued Claims
- Oct 16Industrial Production
- Oct 16Capacity Utilization
ABS-EE filings expected
- Oct 15Santander Drive Auto Receivables TrustSDART · ABS-EE 10-D · last filed Sep 15
- Oct 15Carvana Auto Receivables TrustCRVNA · ABS-EE 10-D · last filed Sep 15
- Oct 15Drive Auto Receivables TrustDRIVE · ABS-EE 10-D · last filed Sep 15
- Oct 15Capital One Prime Auto Receivables TrustCOPAR · ABS-EE 10-D · last filed Sep 15
- Oct 16Ford Credit Auto Lease TrustFCALT · ABS-EE 10-D · last filed Sep 16
- Oct 16CarMax Select Receivables TrustCMXS · ABS-EE 10-D · last filed Sep 16